State Space Models

All state space models are written and estimated in the R programming language. The models are available here with instructions and R procedures for manipulating the models here here.

Saturday, December 14, 2024

A Simple Basic Causal Macro Impact Model


George E. P. Box (1919-2013) was a statistician at the University of Wisconsin--Madison.

Economists are having trouble with macroeconomic models (I posted about the topic here). Macroeconomic modeling got off track by requiring that models have micro-foundations based on expectations, meaning that macro-societal economic forces had to be derived from the individual decisions of economic agents, for example, you and me buying groceries. Unfortunately, there are lots of different ways expectations can be formed (rational expectations, model-consistent expectations, adaptive expectations, etc.)  From the perspective of macro Systems Theory, micro-foundations make a logical category error. "Expectations" are not an attribute of macro-systems but of economic agents. The decision has led to a dead end in macro-economic modeling.

Having a solid basis for macro-modeling makes all sorts of sense. You would like the causal foundations of your theories to be true by definition.* Actually, there are three causal models that macro-economics could be based upon, that is, used to derive other, more complicated models.  They are the Kaya Identity, the Solow-Swan Model of economic growth**, and the AD-AS (Aggregate Demand-Aggregate Supply) Market Model.


NOTES

* In logic, a statement that is true by definition is a tautology.

** Actually, the Solo-Swan model can be derived from the Kaya Identity, so we really only need two models.

Code

If you would like to run the R program in your web browser, cut and paste the following code into the editor window at https://rdrr.io/snippets/.

Kaya <- function (time=100,N=100,n=1.4,L=50,Q=100,q=1.04,CO2=1,
Temp=1,l=.5,e=.75,c=.0002,t=.0001,limit=1) UseMethod ("Kaya")
Kaya.default <- function (time=100,N=100,n=1.4,L=50,Q=100,q=1.04,CO2=1,
Temp=1,l=.5,e=.75,c=.02,t=.01,limit=1) {
TEMP <- matrix(0,time,1)
TIME <- matrix(0,time,1)
for (i in 1:time) {
N <- N * n;
L <- N * l;
Q <- Q * q + L * e;
CO2 <- Q * c;
Temp <- CO2 * t;
TEMP[i,1] <- Temp;
TIME[i,1] <- i;
if (i > time/2) {c <- c * limit}
}
plot(TIME,TEMP)
}
par(mfrow=c(2,2))
# Sample Function Calls
Kaya(n=1.03,q=1.04)
title(main="Exponential")
Kaya(n=.9,q=1)
title(main="Asymptote")
# De-Growth
Kaya(n=.9,q=.9)
title(main="Degrowth")
# Decline
Kaya(n=.6,q=.6)
title(main="Decline")
Kaya(n=1.03,q=1.04,limit=0.95)
title(main="IPCC Slow")
Kaya(n=.9,q=1,limit=0.95)
title(main="IPCC Fast")
Monday, November 25, 2024

The Malthusian Controller


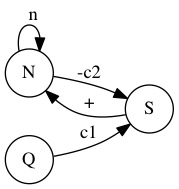
There are lots of versions of the Malthusian Model. Understanding the model, which is very simple (see the directed graph, DG, above) is complicated by all the verbal expositions and criticisms of the model (Marx called it a "stain on the human race"). The model basically says that if the means of subsistence (production, Q, in the DG) does not expand as rapidly as population (N, in the graph above) then the Standard of Living (S) will decrease eventually creating a Malthusian Crisis.

From the standpoint of World-Systems Theory and Cybernetics, the Standard of Living (S) is the Malthusian Controller that keeps population growth in check. Although populations in Western Core Countries have had little or no experience with Malthusian Crises, the Malthusian model is still applicable to historical situations and may, in the future, become applicable to Western societies if Climate Change reduces Q.


The problem with the Classical Malthusian model is that there is no feedback between S and population growth (N). The original model was just two separate equations, one for population (exponential) and one for agricultural production (linear). The possible reactions to the (impending) crisis (positive and negative checks on population growth, what we now recognize as feedback) were not modeled. We can be charitable and forgive Parson Malthus (1766-1834) for not inventing Systems Theory, which was not invented until the 20th Century.

You can run R-code to experiment with the Malthusian Systems Model (with feedback) here and produce the time series plot above with shock decomposition. The model is taken from Germany after Unification in 1871 when there was a brief Malthusian crisis.

Notice that after 1890, a Malthusian Equilibrium is reached when population and production are in balance.